Cross-tool delivery intelligence

One intelligence layer transforms fragmented updates into execution clarity.

PulseBoard cross-references signals across every tool — tickets, commits, conversations, calendar load — surfacing the gap between what people say is happening and what the data actually shows, then runs the response across your stack.
Private beta Live in < 5 min OWASP Top 10 & MITRE compliant
90%
of developers lose 6+ hours per week to coordination and process friction — even while using AI coding tools
Atlassian State of DevEx 2025
$3.3M
annual salary cost wasted per 100-developer org — before overhead, incidents, or opportunity cost
Conservative · BLS 2024 wage baseline
78%
of DevOps professionals waste 25–100% of their time keeping toolchains running
GitLab Toolchain Research 2024
7hrs
lost per team member per week to inefficient processes — on top of what AI already saves them
GitLab Global DevSecOps 2025
The real bottleneck

AI made coding faster.
It did not make system coordination easier.

99% save time with AI tools. 90% still lose 6+ hours weekly — not to code, but to coordination.

The productivity gains are absorbed by the coordination gap above the code. Poor cross-functional communication and weak knowledge sharing — not the work itself — drive most of the weekly time loss.

60%
use 5+ development tools. 49% use 5+ AI tools — fragmentation compounding on itself.
GitLab Global DevSecOps 2025
64%
want to consolidate toolchains — but don't know how to without losing flexibility.
GitLab Toolchain Research 2024
THE BOTTOM LINE
$2M – $3.3M
wasted per year · 100-engineer org · salary cost alone
At $133,080 median annual wage (BLS May 2024). Excludes delayed launches, incidents, revenue slippage, churn.
Why you can't just prompt your way out

What an AI agent can answer —
and what it cannot build.

Prompts answer questions. They don't build the infrastructure.

01 — Continuous system state
Live state, not snapshots
Cannot track evolving state across tools.
02 — Cross-tool causality
Causal chains, not surface reads
Cannot conclude why across team and tool boundaries.
03 — Verification
Is it actually true?
Cannot verify deployed code, config, or environment parity.
04 — Non-prod validation
Fix → deploy → test → compare
Cannot apply, deploy, test, or compare outcomes.
05 — Controlled execution
Policies, approvals, rollout
Cannot create PRs, enforce policies, or gate rollouts.
06 — Confidence layer
Calibrated, not plausible
Cannot compute real confidence — only plausible-sounding answers.
07 — Auditability
Signal → action → outcome
Cannot produce an immutable trace from signal to action.
08 — Learning system
Memory that improves from outcomes
Cannot learn from past incidents to sharpen future calls.
Platform

Five capabilities.
One operating system.

A living model of execution — graphed, scored, and explained — wired into the tools you already run on.

Execution Graph

A living model of how work, teams, systems, dependencies, risks, releases, and decisions connect across the organization.

Tools feeding a unified execution knowledge graph

Dependency Intelligence

A continuously evolving map of cross-team dependencies, blockers, ownership gaps, and coordination risks.

A network map of cross-team dependencies

Confidence Engine

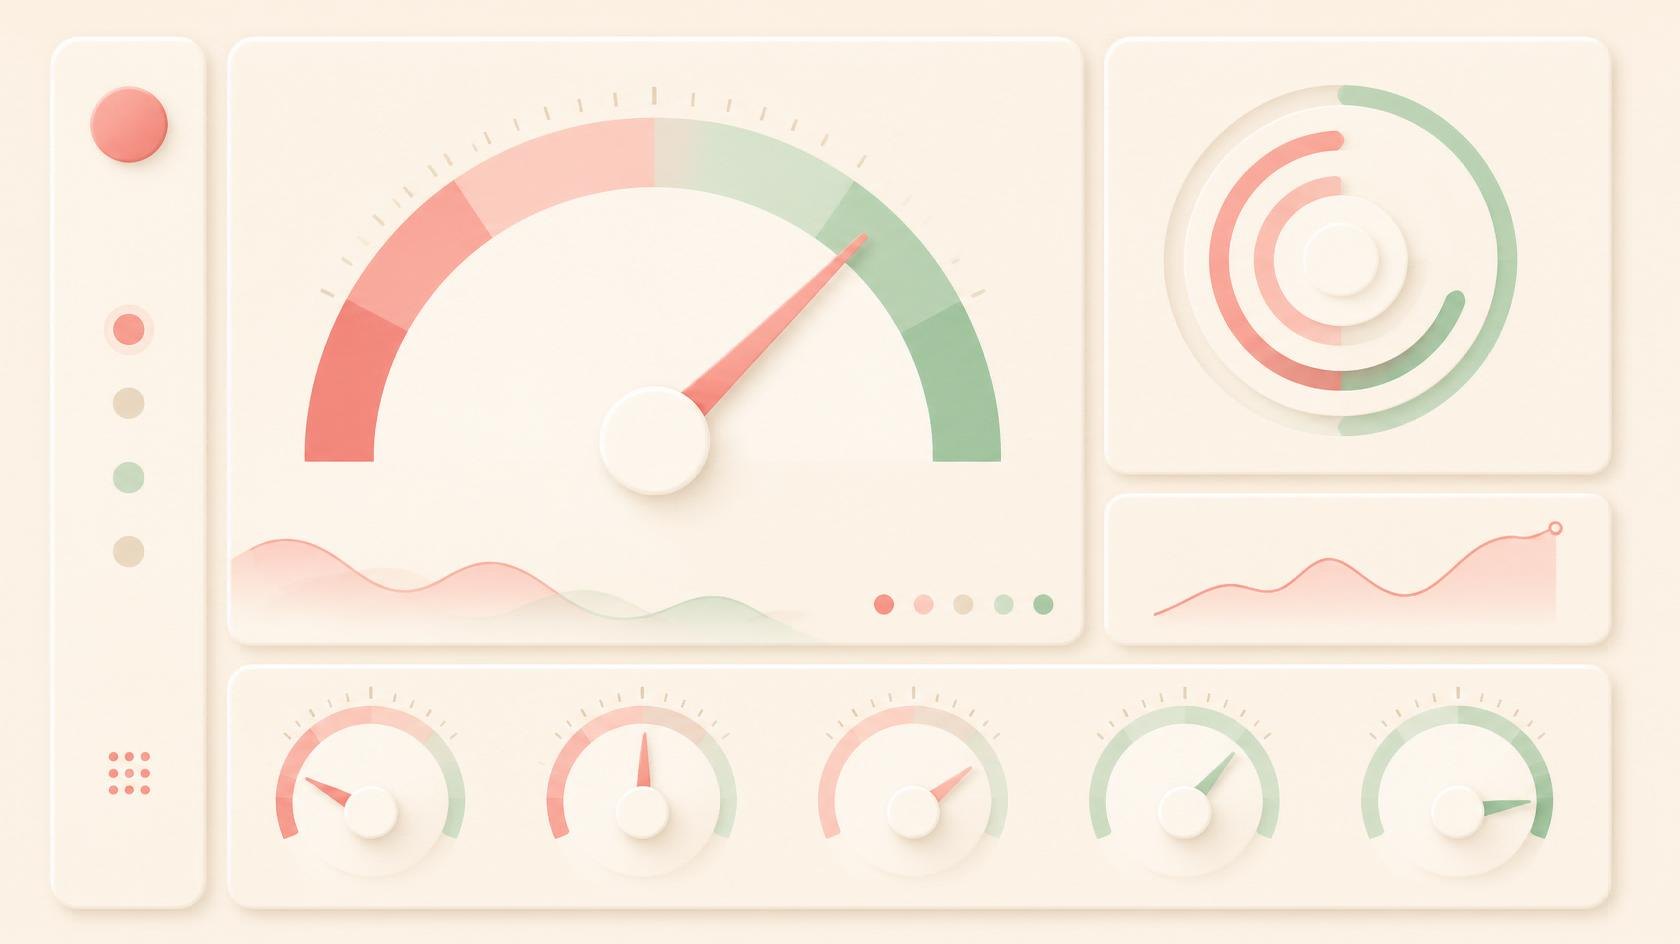
The predictive intelligence layer that measures execution certainty and delivery probability.

Delivery-confidence gauges

Risk Detection

An early-warning system that identifies execution risks before they become visible in status reports.

A radar surfacing emerging execution risks

Executive Narratives

AI-generated explanations that transform execution data into leadership-ready insights.

Raw signals distilled into a leadership briefing
How it works

Intelligence Without Intrusion

PulseBoard operates as a non-intrusive, tool-agnostic operating layer. It observes signals across your stack, scores delivery risk, acts through the tools you already use, and logs every step in real time — without agents, migrations, or workflow changes.

Step 1: Observe

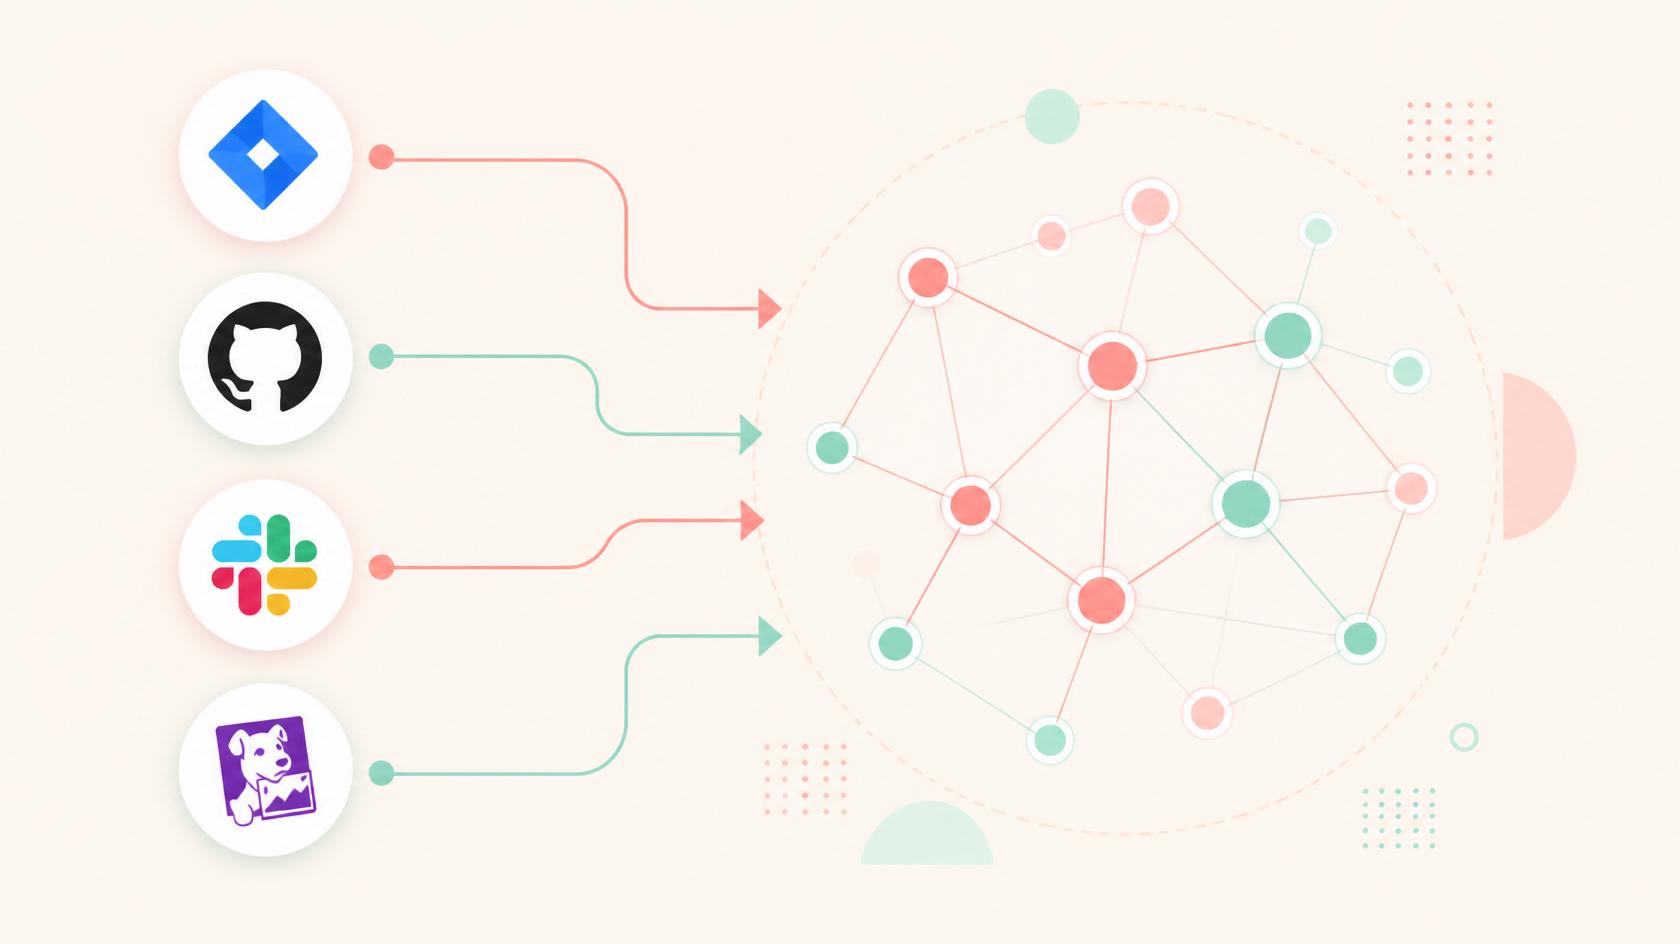
We capture signals from every connected tool.

Connectors stream events from GitHub, Jira, CI/CD, Datadog and PagerDuty into one knowledge graph — no agents to install, no workflow changes.

Step 2: Detect & score

We score delivery risk and verify every change.

A conformal model returns a calibrated risk range, and deterministic checks validate deploy windows, approvals and cross-tool consistency before anything ships.

Step 3: Act & write back

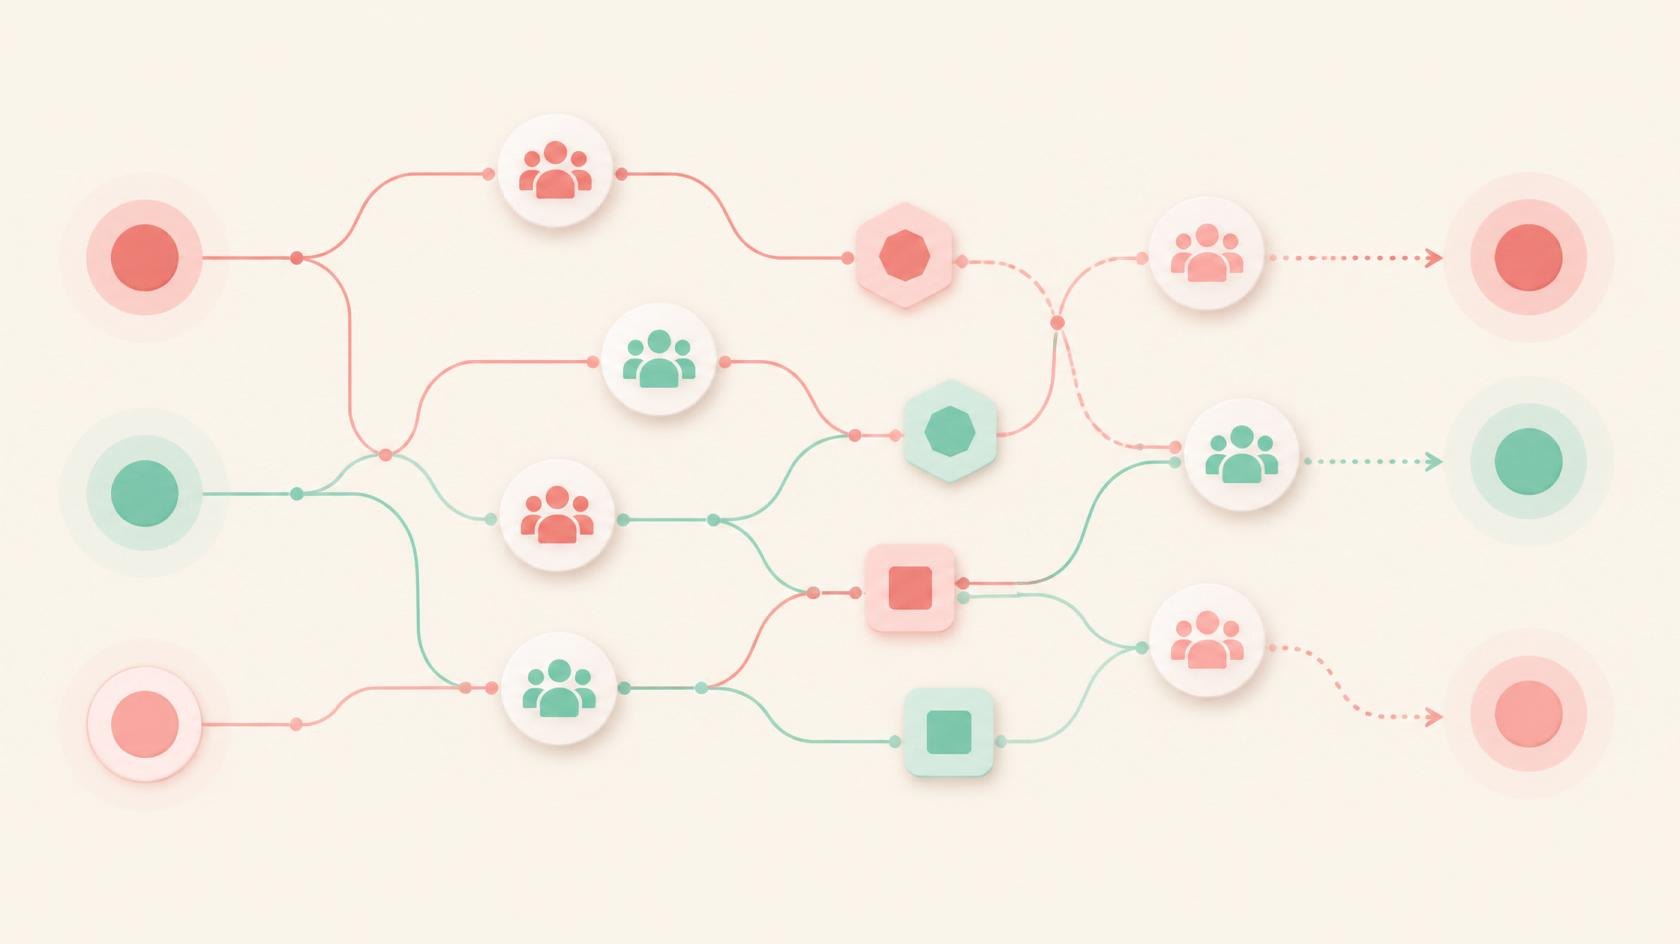
We propagate decisions across your stack.

Approved changes are written back to the source tools — ticket updates, PR status, Slack notices, calendar holds — so every system stays consistent with the human decision.

Step 4: Audit & report

We log every signal, score and action.

An immutable, compliance-ready trail gives engineering and leadership full traceability, exportable to your SIEM in real time.

Architecture

One intelligence layer,
wired into your stack.

PulseBoard connects to the tools you already use, unifies their signals into a single knowledge graph, and writes decisions back — so every system stays consistent with the human in the loop.

Patent filed
Who it's for

Built for the people who own delivery.

From the boardroom to the on-call rotation, PulseBoard gives every layer of the organization one trusted view of execution.

Engineering Leadership

For CTOs, VPs, and Directors who need a trusted view of execution across the organization.

Program Management

For TPMs and PMOs managing complex cross-functional delivery.

Engineering Managers

For managers coordinating dependencies, blockers, and execution risk.

Platform & Infrastructure

For teams operating critical systems, releases, and incidents.

Enterprise Operations

For organizations struggling with fragmented execution data.

FAQ

Common questions.

Everything you need to know before connecting your first tool.

How is this different from just looking at my existing tools?
Your tools only show what teams report into them. PulseBoard cross-references signals across all of them — tickets, commits, conversations, calendar load — surfacing the gap between what people say is happening and what the data actually shows.
Does it store my code or ticket data?
No. PulseBoard reads your tool data in real-time to compute metrics but does not persist your source data on our servers. All processing is ephemeral. Our security practices are compliant with the OWASP Top 10 and MITRE frameworks.
How accurate is the launch probability score?
It's computed from a weighted combination of metrics, each with a target, critical threshold, and a launch impact weight derived from historical program data. It updates in real-time as your tool data changes.
How long does setup actually take?
Under 5 minutes for two tools. The onboarding wizard asks exactly one critical question per tool — everything else is auto-detected. You'll see your first live dashboard before your next meeting.
What if my team uses tools you don't support?
Jira, GitHub, Slack, Linear, and Calendar are live. Notion, Bitbucket, Monday, and Asana are on the roadmap. Enterprise plans include custom integration support.
Can an executive use this without being technical?
Yes. PulseBoard adapts its output to your role. Executives see a launch probability, the top three risks ordered by urgency, and the exact actions that would move the number. No Jira configuration needed.
Frustrated
2
Sarah K · Lisa W
Concerned
3
James · Priya · Tom
Neutral
2
Marcus · David
Satisfied
1
Rachel T
Outreach overdue
3
needs contact today
Sentiment by stakeholder × program response latency · unscheduled check-ins · escalation frequency · meeting attendance
Stakeholder Payment Identity Dev Platform Data Mobile Infra Trend Last touch
Outreach queue sorted by urgency · director-level action needed

Chat with Pulseboard

Ask anything about your delivery state. Citations link to specific records.

Ask me about your delivery state.

Try:

  • "Show me unhealthy metrics and who owns them"
  • "What workstreams are active and at risk?"
  • "Summarize my team structure"

Today I see metrics, workstreams, people, and org structure. Real-time data from connected tools (GitHub, Jira, PagerDuty, etc.) is coming soon.

>